2.4. Time and Cost Estimation
2.4.1. Parametric Modeling Estimation
Parametric modeling uses the characteristics (parameters) of a project in a mathematical model to predict project costs. Models may be simple or complex, depending on the nature of the project. For example, a residential construction project could use a simple model to determine the cost of the project per square foot of living space.
An example of a simple parametric model is Cost = 40 * Resources + 40 * Materials + 20 * Overheads. This model shows that the key drivers are resources and materials when establishing a cost estimate. The factors associated with the variables are weightings that demonstrate their relative impact.
Parametric models are most likely to be reliable when
- historical information used to develop the model is accurate.
- parameters used in the model are readily quantifiable.
- the model is scalable (i.e., it works for large as well as small projects).
Parametric modeling is particularly applicable to environments where the nature of the project work is repetitive (i.e. manufacturing of systems)
2.4.2. Analogous Estimation
Analogous estimation, also called top-down estimating, involves using the actual cost of a previous, similar project as the basis for estimating the cost of the current project. It is often used in the early phases of a project when there is a limited amount of detailed information available.
Analogous estimation is a form of expert judgment about potential resource requirements that can be made available from such sources as other units within the performing organization, consultants, professional and technical associations, or industry groups. It is less costly than other techniques because it is based on existing information. However, it is also generally less accurate because similarities between projects cannot be guaranteed. The process is most likely to be reliable when
- previous projects are similar in fact and not just in appearance.
- individuals or groups preparing estimates have the required expertise.
2.4.3. Bottom-up Estimation
Bottom-up estimation involves estimating the cost of individual project activities or work packages and then summarizing individual estimates to get a project total. Bottom-up estimation is dependent on a well-structured work breakdown structure (WBS). The low level of the WBS presents activities/work packages that can be associated with a time and cost estimate.
As the low-level components of the WBS are estimated, they can be accumulated to present estimates at various levels. The WBS with estimates can also be referred to as a cost breakdown structure (CBS).
When it is not possible to estimate the cost of a complex activity with a reasonable degree of confidence, the work within the activity is deconstructed into more detail. Each piece of work’s resource requirements are estimated, and these estimates are then aggregated into a total quantity for each of the activity’s resources. If there are dependencies between activities, the pattern of resource usage needs to be reflected in the estimated requirements of the activity and these estimates need to be documented.
The size and complexity of an individual activity or work package determines the size and accuracy of bottom-up estimation: smaller activities increase both the cost and accuracy of the estimation process.
2.4.4. Program Evaluation Review Technique
When PERT was first developed, it consisted of a number of basic requirements. For example, the individual tasks undertaken to complete a project must be clear so that they can be sequenced as part of a schedule.
These events and activities are sequenced on the network using a highly logical set of ground rules that allow the determination of critical paths. Time estimates are calculated for each activity on a three-way basis – optimistic, most likely, and pessimistic. These figures should be estimated by the person(s) most familiar with the activity.
PERT’s extensive planning (i.e. three-way basis) helps identify critical path analysis independencies that can be used to indicate where the greatest effort is required to keep a project on schedule. The probability of meeting deadlines by developing alternate plans is another application. For example, the probability of achieving the desired result can be compared against the pessimistic and optimistic estimates.
The three-way basis for estimation (optimistic, most likely, and pessimistic) is used to derive an expected time. PERT is used for R&D projects where the risks in calculating time durations have a high variability, and is the basis for variance simulation.
Functional managers are required to evaluate situations and submit their best estimates when calculating the elapsed time between events. These estimates are more reliable if the manager has a large volume of historical data to work from. In the case of non-repetitive activities, functional managers must base their estimates on three possible assumptions related to the completion time:
- the most optimistic completion time – assumes that everything will go according to plan and that difficulties will be kept to a minimum
- the most pessimistic completion time – assumes that everything will not go according to plan and the maximum number of difficulties will develop
- the most likely completion time – this is the time that most often occurs when this event occurs many times.
To combine these three times into a single expression for expected time, two more assumptions must be made:
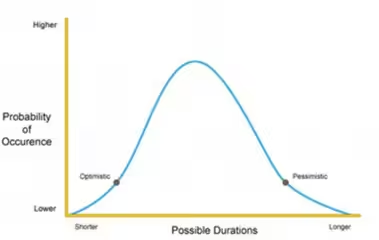
- standard deviation is one-sixth of the time requirement range This assumption is based on the probability theory, where the end points of a curve are three standard deviations from the mean. The standard deviation is a measure of uncertainty. It can also be defined as the difference between the forecast and the actual. The higher the standard deviation is, the greater the risk or variance associated with the project.
- the probability of distribution of the time required to perform an activity must be expressible as a beta distribution
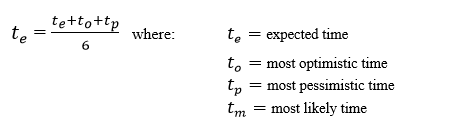
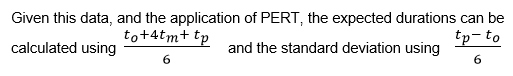
PERT uses the following expressions to find the expected time between events:
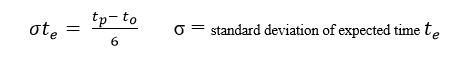
In order to calculate the probability of completing the project on time, the standard deviation of each activity can be obtained from this expression:
Another expression that can be used is variance (v), which is the square of the standard deviation. This expression is useful when comparing expected values.
The following are the optimistic, most likely, and pessimistic estimates available for a project to sign a contract:
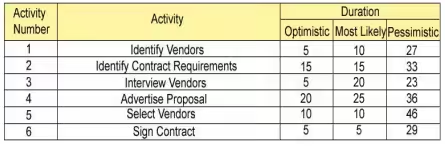
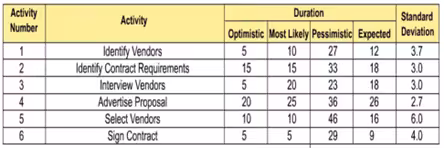
When the project expected duration is applied, the project network is as follows, with extended project duration of 60 days.
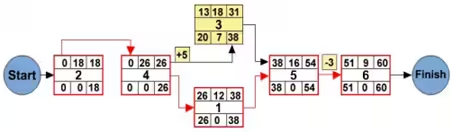
This indicates that there is a time risk associated with this network. For example, the duration for selecting vendors is between 10 days (optimistically) and 46 days (pessimistically). The expected duration is 16 days. However, this may be an activity that requires contingency. Contingency is discussed in detail in the next topic.