2.3. Developing a Project Schedule
2.3.1. Project Management Plan VS Project Schedule
A project management plan is a formal, approved document used to manage project execution and control. The primary use of the project management plan is to document all plans and facilitate communication among stakeholders with approved scope, cost and schedule baselines. The components of a project management plan include:
- project charter
- project scope statement
- work breakdown structure
- scope management plan
- master project schedule
- schedule management plan
- project cost baseline
- cost management plan
- project risk management plan
- project quality management plan
- procurement management plan
- project communication management plan
- project change management plan
- project staffing management plan
2.3.2. Developing a Project Schedule
A project schedule lists planned dates for performing activities and meeting milestones identified in the project management plan.
Developing a project schedule involves analyzing project activity sequences, durations, and resource requirements to determine start and finish dates for project activities. Start and finish dates must be realistic if the project is to finish as scheduled.
The main inputs in the schedule development process are calendars and constraints (including constraints specific to government projects).
Calendars. Project and resource calendars identify periods when work can take place. Project calendars affect all resources – for example, some projects take place only during normal business hours, whereas other projects include day and night shifts.
Resource calendars affect a specific resource or category of resources – for example, a project team member may be on vacation or certain categories of workers may only be available on certain days of the week.
Application of calendars to project schedules is accomplished through the use of software applications, where the project is allocating resources and activities. With government projects, it may be that project resources will not work weekends or public holidays. This is reflected in the project schedule using a calendar of available and non-available times.
Constraints limit a project management team’s options. The two main categories of time constraints considered during schedule development are imposed dates and key events or major milestones.
- Imposed dates. These dates are used to restrict project start or finish dates so that they occur either no earlier than a specified date or no later than a specified date. The “start no earlier than” and the “finish no later than” constraints are the most commonly used imposed dates. Situations where imposed dates impact project schedules are weather restrictions on outdoor activities or restricted delivery dates for materials from third parties.
- Key events or major milestones. These are significant project events that mark the completion of certain deliverables by a specified date. Project stakeholders often request that such dates be included in the schedule. Once scheduled, these dates become expected and may only be changed with great difficulty.
Milestones are often used to indicate interfaces with work that is outside – but linked to – the scope of the project.
Government projects face another constraint in the form of the annual budget cycle (Government Extension to the PMBOK® Guide Third Edition; p40). Elected officials typically approve budgets that last for one fiscal year at a time. If there are “use it or lose it” provisions that require funds to be spent by the end of a fiscal year, any project delays can cause the loss of funding if work moves from one fiscal year into the next.
The project schedule is the main output from schedule development and includes at least the planned start and expected finish dates for each project activity. The project schedule, which is a preliminary schedule until resource assignments have been confirmed, is presented in summary form (the master schedule) or in detail.
The project schedule is generally presented graphically, using one or more of the following formats:
- project network diagrams
- bar charts
- milestone charts
- Gantt charts
Bar charts indicate activity start and end dates, as well as expected durations. Bar charts are easy to read and are often used in management presentations.
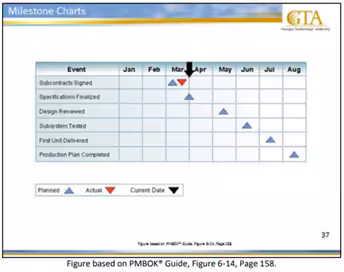
Milestone charts are similar to bar charts, but they only show the scheduled start or completion of major deliverables and key external interfaces. A milestone is an activity with zero duration. A milestone should be associated with significant deliverables or events in a project. Milestones are generally associated with significant events, such as
- project start
- project finish
- deliverables or reports
- availability of product items, etc.
Bar charts and milestone charts are subsets of the Gantt chart. The Gantt chart is connected to the WBS as both reflect project activities. The WBS presents work packages, which can be decomposed further into specific project activities. A Gantt chart presents these project activities in a sequenced and logical fashion, with associated time and resource estimates.
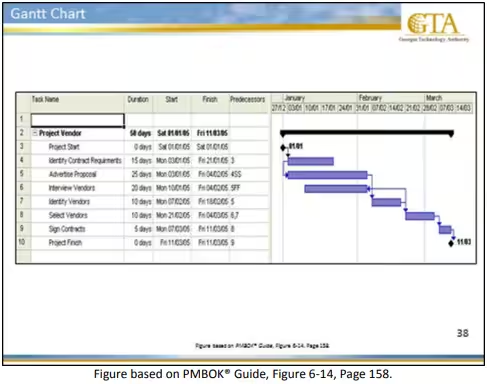
A Gantt chart is an ideal way of presenting a network schedule. The slide illustrates a project network diagram with date information added.
Project network diagrams generally show both the activity dependencies and the project’s critical path activities.
2.3.3. Critical Path Method
The critical path is the series of activities that determines the duration of a project. In a deterministic model, the critical path is defined as those activities with float less than or equal to a specified value, often zero. It is the longest path through the project.
Critical path method (CPM) is a network analysis technique used to predict project duration by analyzing which sequence of activities (which path) has the least amount of scheduling flexibility (the least amount of float). Early dates are calculated by means of a forward pass, using a specified start date. Late dates are calculated by means of a backward pass, starting from a specified completion date (usually the forward pass-calculated project early finish date).
CPM calculates the theoretical early and late start and finish times for all project activities without taking into account resource limitations. The resulting times indicate the time periods within which the activity could be scheduled given resource limits and other known constraints. Calculated early and late times are the same on the critical path because float is zero. On non-critical paths, the schedule flexibility is called total float and is calculated using the difference between early and late times.
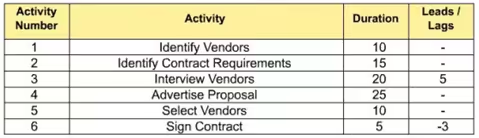
2.3.4. Leads and Lags
A lead is a modification of a logical relationship that allows an acceleration of the successor task. For example, in a finish-to-start dependency with a ten-day lead, the successor activity can start ten days before the predecessor has finished.
A lag is a modification of a logical relationship that directs a delay in the successor task. For example, in a finish-to start dependency with a ten-day lag, the successor activity cannot start until ten days after the predecessor has finished. Such a lag might be required between ordering a piece of equipment and installing or using it.
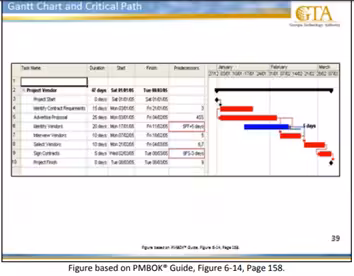
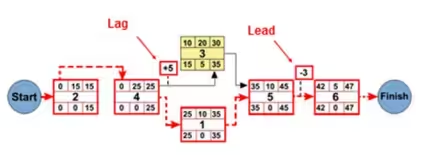
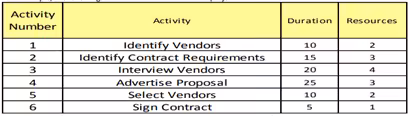
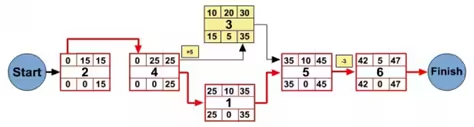
In the example shown on the slide, the project team decides on the following after analyzing the project network:
- a five-day lag is required between “interviewing vendors” and “advertising the proposal”. This allows for any late applications to arrive.
- a three-day lead is identified between “signing the contract” and “selecting vendors” as the project team believes that preparatory work can be started on the contract during the time of selecting the vendors.
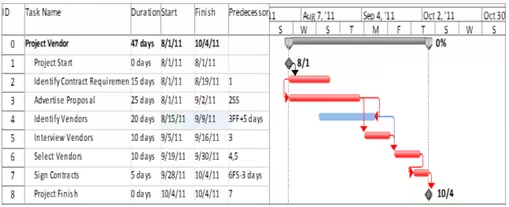
The activity list (showing leads and lags) can be transferred into a network diagram with project duration of 47 days (see slide).
The Gantt chart displayed below is the equivalent of the network diagram with the leads and lags.
2.3.5. Schedule Compression
Schedule development entails determining the start and finish dates for project activities. It involves analyzing activity sequences, activity durations, and resource requirements to create an accurate project schedule. It makes use of the following techniques:
- schedule analysis – used to calculate the theoretical time period of the project, which is the early start and finish dates of all project activities given resource limitations and other known constraints
- duration compression – a special form of mathematical analysis that tries to shorten the project schedule without changing the project scope. There are two major duration compression techniques, crashing and fast tracking:
- crashing involves analyzing cost and schedule tradeoffs to determine how, if at all, the greatest amount of compression can be obtained for the least incremental cost
- fast tracking involves conducting activities in parallel that would normally be done in sequence
- simulation – used to calculate multiple project durations with different sets of activity assumptions
- resource leveling – used to balance resource allocation (e.g. allocating additional resources to a project to ensure that its duration is in line with the original estimate)
- project management software – used to help automate certain tasks, for example the calculation of mathematical analysis, and to help create alternative schedules quickly
Schedule compression uses many of these techniques. The most widely known schedule analysis techniques are
- critical path method (CPM)
CPM calculates a single, deterministic early and late start and finish date for each activity. This is based on specified, sequential network logic and a single duration estimate. The aim of CPM is in calculating float to determine which activities have the least scheduling flexibility.
- critical chain method
Critical Chain Method modifies the schedule to level over-allocated resources along the critical path. This often results in a different critical path than before adding resources to the activities. Another feature of the critical chain method is the use of buffers. The project buffer is added at the end of the project as a contingency for schedule slippage. Additional buffers called feeding buffers are inserted to those activities that feed the critical path to protect against schedule slippage that feeds the critical path.
Duration Compression – Crashing
Crashing involves analyzing cost and schedule tradeoffs to determine how, if at all, the greatest amount of compression can be obtained for the least incremental cost. Crashing does not always result in a viable alternative and it may in fact increase cost.
The activities on the critical path are examined to understand where time savings can be made. While this results in project time saving, the budget is impacted as very often time savings result in increased resources, materials or equipment.
Using the CPM approach, project managers can determine the cost of speeding up or crashing certain phases of a project. To do this, it is necessary to calculate the normal expected time for each activity and the crashing cost per unit time. CPM charts, which are closely related to PERT charts, show the visual representation of the effects of crashing.
Only those activities on the critical path are considered, starting with the activities for which the crashing cost per unit time is lowest. If the critical path consists of four activities, the first activity to be crashed is the one with the lowest crashing cost. The activity with the next lowest crashing cost is crashed next and so on.
When an activity is crashed, there is a strong possibility that a new critical path will be developed, which may include those elements that were bypassed because they were not on the original critical path.
Duration Compression – Fast Tracking
Let’s assume management wishes to keep the end date of a project fixed, but the start date is delayed because of a lack of adequate funding. How can this be accomplished without sacrificing quality? The answer is to fast track the project.
Fast tracking involves conducting activities in parallel that would normally be done in sequence. Fast-tracking a job can accelerate the schedule but requires that additional risks be taken. If the risks materialize, then either the end date will slip or expensive rework will be needed. Almost all project-driven companies fast-track projects, but there is danger when fast-tracking becomes a way of life.
Simulation
Project management uses simulation to calculate multiple project durations with different sets of activity assumptions. Monte Carlo analysis, a common simulation technique, involves defining a distribution of probable results for each project activity and using the results to calculate a distribution of probable results for the total project.
Monte Carlo analysis is based on random number generation where the algorithm presents a distribution of data between selected limits.
Here is a sample strategy for combining critical chain and simulation methods in a way that can be very beneficial to project management:
- develop the work breakdown structure and activity network diagram in the usual way
- obtain quality judgments about activity completion times and resource requirements. This is usually achieved by interviewing the best available experts. These judgments should be expressed as probability distributions. Breaking apart important contingencies is a good way to obtain a better representation and a more realistic estimate.
- understand that learning is essential to improving future judgments. A graphic of actual outcomes versus estimates is an excellent feedback tool.
- develop a project model. As available resources permit, shorten the project management schedule to conduct more activities in parallel (being careful to recognize resource conflicts and multi-tasking inefficiencies).
- provide activity leaders with convenient access to the project model. The project manager should be especially involved in monitoring ongoing activities and alerting workgroups to be prepared as work on critical activities approaches.
2.3.6. Resource Leveling
Resource leveling (also known as the resource-based method) is any form of network analysis in which scheduling decisions (start and finish dates) are determined by resource management concerns (e.g., limited resource availability or difficult-to-manage changes in resource levels). Resource leveling frequently results in a project duration that is longer than the preliminary schedule.
Reallocating resources from non-critical to critical activities is a common way to bring the schedule back, or as close as possible, to the originally intended overall duration. In addition, using extended working hours or different technologies can help shorten durations that have extended the preliminary schedule. Fast tracking can also be used to reduce the overall project duration.
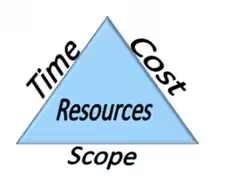
Some projects have finite and critical project resources that must be scheduled in reverse from the project ending date. This is known as reverse resource allocation scheduling. As we’ve learned, the critical chain modifies the project schedule to account for limited resources. Successful project management is both an art and a science that attempts to control corporate resources within the constraints of time, cost, and performance. Most projects are unique activities for which there may not be reasonable standards for forward planning. As a result, the project manager may find it extremely difficult to stay within the time-cost performance triangle shown in the slide.
The duration of most activities is significantly influenced by the resources assigned to them. For example, two people working together may be able to complete a design activity in half the time it takes either of them individually. A person working half time on an activity will generally take at least twice as much time as the same person working full time.
As additional resources are added, projects can experience communication overload, which reduces productivity. Production tends to improve proportionally less than the increase in resource.
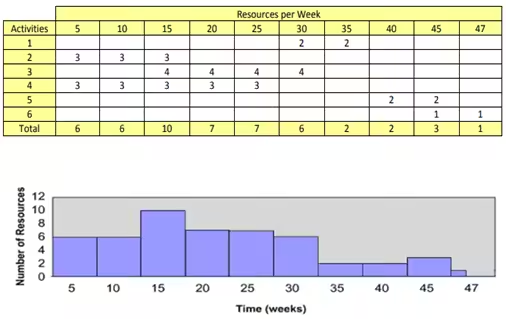
In this example, the following resources are available for the project:
And when applied to the following project network, the resulting resource profile is
The cart below depicts the number of resources needed per week based on the network diagram.