2.2. Sequencing Project Work
2.2.1. Logic Diagram
The first step in the planning process is to determine the logical flow of all project activities from the beginning to the end of the project. This is done using a logic diagram.
A logic diagram, also known as a project network diagram, is a schematic display of the logical relationships of project activities. Project activities are presented as boxes connected by arrowed lines that point from left to right. In this way, a procedure or sequence for undertaking projects activities is presented.
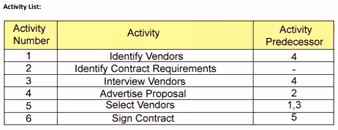
Here is an example of a basic activity list for selecting a vendor for a generic government project; along with a corresponding logic diagram that shows the sequence of work and the relationships between activities:
Logic diagrams are probably the most difficult figures to construct. They are developed to illustrate the inductive and deductive reasoning necessary to achieve some objective within a given timeframe.
Characteristics of a logic diagram include:
- a sequence of adjacent points connected by lines
- a directed path that represents and end-to-end cycle of project activities
- a number of paths and chains taken directly from the activity list
- a process developed on paper to indicate a starting point for project time planning
- a series of boxes each of which is an event box
Logic diagrams display the relationships between project activities in a logical sequence. When connecting these activities in a sequence, it is necessary for the planner to continually ask the following questions:
- what activities must be done before the activity I am currently considering? In other words, what precedes this activity?
- what activities can be carried out at the same time as the activity I am considering?
- what activity can be started after the activity that I am considering? What succeeds this activity?
Each activity has a successor and a predecessor, collectively known as dependencies. When activities occur at the same time as the activity being considered, they are said to be concurrent.
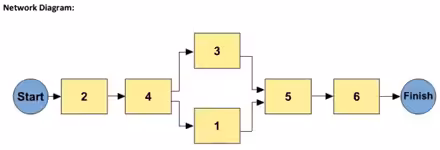
For example, the above slide displays the logic diagram for selecting a vendor for a generic piece of work. Several pieces of information can be interpreted from the diagram.
For example, activity 2 is a predecessor of activity 4 because you have to identify contract requirements before you advertise. Also, activity 1 is concurrent with activity 3 because you identify and interview vendors at the same time. Activity 6 is a successor to activity 5 because you have to select vendors before you sign contracts with them.
The logic diagram shown here also displays a start node and a finish node as circular.
Logic diagrams are useful purely as starting points for visualizing the sequence of activities from the presented activity list.
Dependency Determination
Logical dependencies can be mandatory, discretionary, or external.
- Mandatory dependencies
Also known as hard logic, these are inherent in the nature of the work being done. Mandatory dependencies often involve physical limitations – for example, it would be impossible to test a product before it has been assembled.
- Discretionary dependencies
Also known as preferred or soft logic, these are generally defined by the project management team during the process of establishing the sequence of activities. They are based on knowledge of
- best practice – activities are sequenced with knowledge of what is considered best practice
- some unusual aspect of the project – where a specific sequence is desired, even though there are other acceptable sequences
- preferred activity sequences – based on previous experience of a successful project performing the same type of work
- obligations – which are particularly useful for projects with large procurements. On many government projects, the main product of the project is purchased from the private sector. Some governments can obligate the funds for these contracts if the contract is signed before the end of the fiscal year. This obligation places the contract funds into a separate account that can be used only for the specific contract. The planning of such obligations can be considered based on the discretion of the project team.
- External dependencies
These are dependencies that have interfaces with other projects or with non-project activities. An example is the beginning of a project in an unknown territory, where you may need to account for the political situation.
Determining project dependencies is an important part of constructing a logic diagram. Only when you understand the dependencies, and therefore the successor and predecessor to each activity, will you be able to arrange all project activities in a logical sequence.
2.2.2. Activity Sequencing (AON/AOA)
A logic or network diagram shows a sequence of work, including whether activities can be done at the same time or have to be done in a particular order. In addition, network diagrams have the following characteristics:
- they include durations in the form of start and finish dates for each activity
- they can show whether the timing of a particular activity is crucial to finishing the project by a given completion date (i.e. critical path)
- they can demonstrate milestones and in turn can be used to control project progress
There is one type of network diagram that is commonly used – activity-on-node (AON).
Activity On Node
Activity on Node (AON) is a diagramming method that uses boxes or rectangles (nodes) to represent activities and connects them with arrows that show dependencies. AON – which was introduced by two major corporations (DuPont and Sperry Road) – is the more popular type of diagram that defines the paths and activities that are critical to the project, and is associated with the critical path method (CPM).
AON includes four types of dependencies or precedence relationships:
- finish-to-start – the start of the work of the successor depends on the completion of the work of the predecessor (this is the most commonly used type of logical relationship)
- finish-to-finish – the completion of the work of the successor depends on the completion of the work of the predecessor
- start-to-start – the start of the work of the successor depends on the start of the work of the predecessor (these relationships are rarely used and only by professional scheduling engineers)
- start-to-finish – the completion of the successor depends on the start of the predecessor
Start-to-start, finish-to-finish, or start-to-finish relationships can produce unexpected results because these types of relationships have not been consistently implemented.
Standardized networks can be used in preparing project network diagrams. They can include an entire project or only a portion – subnet or fragment – of it. Subnets are particularly useful when a project includes several identical or nearly identical features, such as floors on a high-rise office building.
The slide illustrates a network template, commonly known as a precedence diagramming method
2.2.3. Activity Relationships for Precedence Diagramming Method
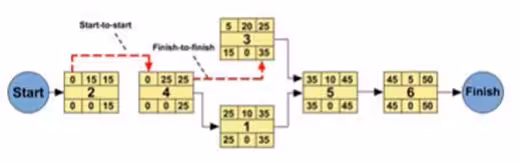
When examining any network, the relationships should be analyzed and categorized. In the example of selecting a vendor, it can be assumed that as soon as the contract requirements are formulated, the vendor may be identified. Hence this is a start-to-start relationship.
In addition, as soon as the vendor is identified, the interviews can be finished, giving a finish-to-finish relationship.
The network diagram shown on the slide does not change the logic of the preceding example, but rather presents the logic using different types of relationships:
- finish-to-start: this is often the default / inherent relationship that exists in logic diagrams and are presented as non-highlighted connections in the graphics
- start-to-start
- finish-to-finish
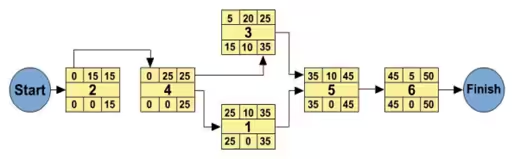
2.2.4. Precedence Diagramming Method
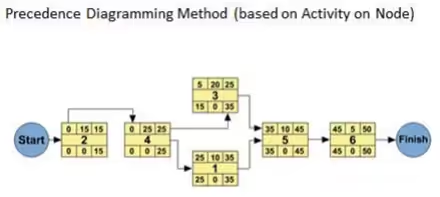
The precedence diagramming method (PDM) is a way of constructing a project network diagram that employs boxes or rectangles (nodes) to represent the activities and connects them with arrows that show the dependencies. Essentially, it is an AON network logic diagram with time added.
To calculate project duration using a PDM, you identify the early start and early finishes using a calculation known as forward pass. A similar calculation, known as backward pass, is used to calculate the critical path for the project with the float of each activity.
Forward pass is the calculation of the early start and early finish dates for the uncompleted portions of all network activities.
- Early Start Date: In the critical path method, the early start date is the earliest possible point in time at which the uncompleted portions of an activity (or a project) can start, based on the network logic and any schedule constraints. Early start dates can change as the project progresses and changes are made to the project plan.
- Early Finish Date: In the critical path method, the early finish date is the earliest possible point in time at which the uncompleted portions of an activity (or a project) can finish, based on the network logic and any schedule constraints. Early finish dates can change as the project progresses and changes are made to the project plan.
Let’s take a look at three examples of forward pass.
- Forward pass with a finish-to-start date: The early finish of the preceding activity becomes the early start of the succeeding activity. An example is activity 6, which has an early start that is the same as the early finish of activity 5 (i.e. 45 days).
- Forward pass with a start-to-start date: The early start of the preceding activity becomes the early start of the succeeding activity. An example is activity 4, which has an early start that is the same as the early start of activity 2 (i.e. 0 days).
- Forward pass with a finish-to-finish date: The early finish of the preceding activity becomes the early finish of the succeeding activity. An example is activity 3, which has an early finish that is the same as the early finish of activity 4 (i.e. 25 days). In this case, the early start of activity 3 is 5 days (i.e. early finish of 25 days – duration of 20 days).
The rule for the forward pass is to always take the highest preceding constraint.
The duration for this schedule is 50 days, as illustrated on the figure.
Backward pass is the calculation of late finish dates and late start dates for the uncompleted portions of all network activities. It is determined by working backwards through the network logic from the project’s end date. The end date may be calculated in a forward pass or set by the customer or sponsor.
- Late Start Date: In the critical path method, the late start date is the latest possible point in time that an activity may begin without delaying a specified milestone (usually the project finish date).
- Late Finish Date: In the critical path method, the late finish date is the latest possible point in time that an activity may be completed without delaying a specified milestone (usually the project finish date).
- Float: Float is the amount of time that an activity may be delayed from its early start without delaying the project finish date. Float is a mathematical calculation and can change as the project progresses and changes are made to the project plan. Float is also called slack, total float, and path float.
Let’s take a look at three examples of backward pass.
- Backward pass with a finish-to-start date: The late start of the succeeding activity becomes the late finish of the preceding activity. An example is activity 5, which has a late finish that is the same as the late start of activity 6 (i.e. 45 days).
- Backward pass with a start-to-start date: The late start of the succeeding activity becomes the late start of the preceding activity. An example is activity 2, which has a late start that is the same as the late start of activity 4 (i.e. 0 days). In this case, the late finish of activity 2 is 15 days (i.e. late start of 0 days + duration of 15 days).
- Backward pass with a finish-to-finish date: The late finish of the succeeding activity becomes the late finish of the preceding activity. An example is activity 4, which has a late finish that is the same as the late start of activity 3 if the constraint with activity 1 was not present (i.e. 35 days).
The rule for the backward pass is to always take the lowest succeeding constraint.
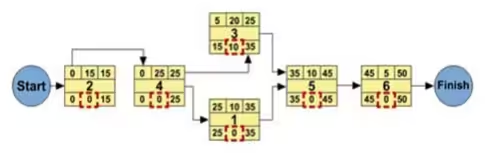
Float is calculated for each activity by identifying the difference between late starts and late finishes. If these are the same, the float is zero, which indicates a critical activity. Remember that float is the amount of time that an activity may be delayed from its early start without delaying the project finish date. For example activity 3 can be delayed 10 days without affecting the overall project duration. This float is calculated by subtracting the late start time from the early start time for activity 3.
In summary, the precedence diagramming method (PDM) combines a network logic diagram with estimated durations for each activity:
2.2.5. Guidelines to Estimation
Reliable estimates are a key element of a good schedule and cost baseline plan. Because there is no exact science for making estimates, it is important to have a thorough understanding of the definitions and guidelines that are available.
An estimate is an assessment of the likely quantitative result of a project. It is usually applied to project costs and durations and should always include some indication of accuracy (e.g., ±x percent). An estimate is generally used with a modifier (e.g., preliminary, conceptual, feasibility), and some application areas have specific modifiers that imply particular accuracy ranges (e.g., order-of-magnitude estimate, budget estimate, and definitive estimate in engineering and construction projects).
Time estimating is the process of developing project activity durations for input to schedules based on project scope and resource information. An estimate is frequently progressively elaborated and can be assumed to be progressively more accurate. Team members most familiar with the nature of a specific activity should make, or at least approve, an estimate.
Elapsed time may need to be factored into estimates for the number of work periods required to complete an activity. For example, if concrete curing for a construction project requires four days of elapsed time, it may require from two to four work periods, based on a) which day of the week it begins, and b) whether weekend days are treated as work periods.
This issue can be handled using computerized scheduling software that employs alternative work-period calendars.
Cost estimating is the process of developing an approximation (estimate) of the costs of the resources required to complete project activities. This process includes identifying and considering various costing alternatives. For example, the cost-estimating process must consider whether additional work during a project’s design phase will be offset by the expected savings in the production phase of the project.
A distinction should be drawn between cost and price estimating:
- cost estimating involves developing an assessment of the likely quantitative result of a project – the cost of providing a product or service
- price estimating is a business decision that uses the cost estimate as one of many factors to decide how much to charge for the product or service
2.2.6. Activity Resource Requirements
Activity resource estimating is the process of determining what physical resources (people, equipment, and materials) are required for a project, what quantities of each resource should be used, and when the resource will be available to perform project activities. This process must be closely coordinated with cost estimating.
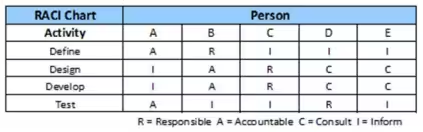
At the outset of any project, project roles (who does what) and responsibilities (who decides what) need to be assigned to the appropriate project stakeholders. Project roles and responsibilities, which may vary over time, should be closely linked to the project scope definition. A Responsibility Assignment Matrix (RAM), as illustrated on the slide, is frequently used to make this link. RAMs are developed at various levels for projects. For example, a high-level RAM defines which group or unit is responsible for each component of the work breakdown structure, whereas lower-level RAMs are used within the group to assign roles and responsibilities for specific activities to individual members of the group.
Up-to-date and accurate knowledge about resource availability is necessary for activity resource estimating. Assumptions made about the availability of each resource – such as the amount and type of resource, its location, and the time periods of availability – should be documented. Resource descriptions can vary over the course of a project. For example, in the early phases of an engineering design project, available people resources may include large numbers of junior and senior engineers, with the pool limited in later stages of the project to individuals who have gained specific experience in the earlier phases.
The output of the activity resource estimating process is a description of activity resource requirements – the types and quantities of resources needed for each activity in a work package. The estimated resources for each work package are determined by aggregating these requirements. Resources requirements for higher-level components of the work breakdown structure can then be worked out based on the lower-level values, with the schedule development process determining when the resources are needed (see lesson 3 for a discussion of the schedule development process).
Government HR Systems
The civil service distinguishes government human capital management from that in the private sector (Government Extension to A Guide to the PMBOK® Guide Third Edition; Chapter 9). In an elected government, policies are likely to change from one election to another. Equally, the availability of project resources may be affected by the tenure of elected officials or appointed civil servants.
Civil servants hold office from one administration to another, and remain politically neutral. As a guarantee of this neutrality, they have tenure in their positions. Consequently, project managers in the civil service do not usually choose their staff – the project manager must create a viable performing team from what he or she is given. Thus project managers need to master teambuilding skills, understand the different personality types, and motivate these individuals to produce a functioning team.