
5.5. The Site Audit Phase
5.5.1. A Practical Auditing Methodology – The 10 Steps
The Energy Audit is a systematic assessment of current energy use practices, from point of purchase to end-use, the energy audit identifies in quantitative terms:
- How and where energy enters the facility, department, system or piece of equipment;
- Where it goes and how it is used;
- Any variances between inputs and uses;
- How it can be used more effectively or efficiently.
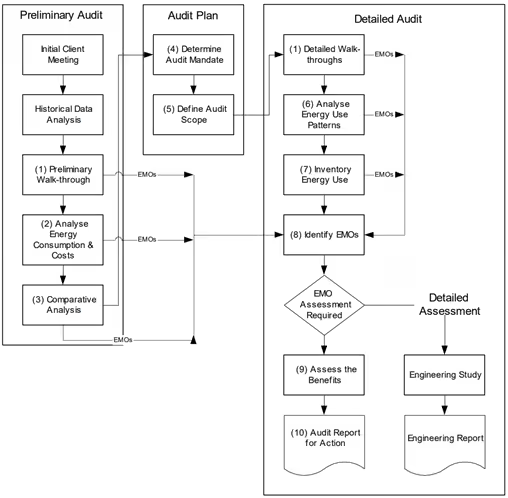
Figure below summarizes the sequence of steps involved in the audit methodology.
Audit Process Flow Chart
The key steps in the Audit, after the initial client meetings and historical data analysis, are:
- Conduct a Walk-through Inspection – to assess the general level of repair, housekeeping, and operational practices that have a bearing on energy efficiency, and to flag situations that have merit for further assessment as the audit is implemented; walk-through inspections will also be carried out to verify the findings of other analysis steps, as indicated in the flow chart;
- Analyze Energy Consumption and Costs – collect, organize, summarize and analyze historical energy billings and the tariffs that apply to them;
- Compare Energy Performance – determine energy use indices and compare them internally from one period to another, one facility to a similar one within your portfolio, one system to a similar one; or externally to measures of good practice within your industry;
- Establish the Audit Mandate – secure commitment from manage and define expectations and outcomes of the detailed audit;
- Establish the Audit Scope – define the energy consuming system to be audited.
- Profile Energy Use Patterns – determine the time relationships of energy use, as in the electricity demand profile;
- Inventory Energy Use – prepare a list of all energy consuming loads in the audit area, and quantify their consumption and demand characteristics;
- Identify Energy Management Opportunities – including operational and technological measures to reduce energy waste.
- Assess the Benefits – quantify the level of energy and cost savings, along with any co-benefits.
- Report for Action – report the audit findings and communicate as required for implementation
Each step involves a number of tasks that are described in the following sections. As suggested by the flow chart, several of the steps may result in the identification of potential EMOs.
Final Steps
A wide range of potential EMOs may be identified by the audit. It may be that the assessment of some of the EMOs will be beyond the scope of the audit, requiring a more detailed engineering study. Other EMOs will not require further study and the savings will likely be significant and rapid; in these cases, immediate implementation will be the logical course of action.
Step 1: The Walk-through—a building condition survey
The initial walk-through of the facility, or condition survey, is basically an inspection tour of the facility in which attention is given to:
- Where energy is quite evidently being wasted;
- Where repair or maintenance work is needed;
- Where capital investment may be needed in order to improve energy efficiency.
The walk-through serves at least three purposes:
- it provides an orientation to the entire facility for the more detailed audit, specifically in regard to major uses of energy and the influencing factors;
- it helps to identify areas within the facility that warrant further examination for potential energy management opportunities as a precursor to establishing the audit mandate and scope;
- it identifies obvious opportunities for energy savings that can be implemented with virtually no further assessment; often these are issues of poor repair or housekeeping measures that do not involve significant expenditures of capital.
A Systematic Approach
It is important that the walk-through be both comprehensive and systematic. Although the information generated is mainly qualitative, it is helpful to attribute quantitative scores to the observations as an indication of the severity of the situation and the urgency of corrective action.
Towards that end, a checklist approach to information collection is suggested, together with a condition rating point count system. The checklist template can be readily modified and adapted to the specifics of your facility; for example, in a survey of lighting, a line for each room or distinct area in the facility can be created.
The rating system for use with the walk-through checklist is based on a 3-point count system, in which
- 3 represents a condition that is highly energy efficient,
- and 0 represents a condition that is very poor from an energy efficiency point of view.
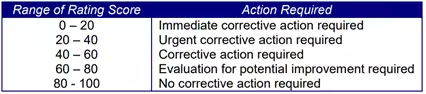
The rating score indicates the urgency of corrective action.
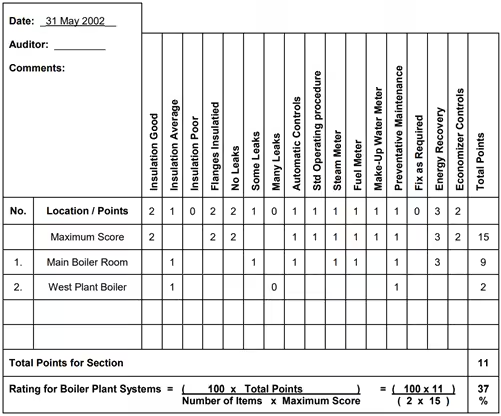
After each checklist is completed, a “Rating Score” is calculated, according to the following formula and the example given above
This rating score is then used to indicate the urgency of corrective action, according to the following scale:
The Checklists that are provided in the Appendix address the following facility systems:
- Windows
- Doors
- Ceilings
- Walls
- Roofs
- Storage Areas
- Shipping and Receiving Areas
- Lighting Systems
- Food Areas
- Heating Plant
- Heating Distribution Systems
- Cooling Plant
- Cooling Distribution Systems
- Electrical Power Distribution Systems
- Hot Water Service 16. Cold Water Service
- Cold Water Service
In each case, only the template headings are shown, along with the scoring structure. At the end of the section is a blank template that can be customized to these specific systems in your facility and others not included in this list. In the latter case, thought should be given to a scoring structure similar to that shown for these systems.
Finding Energy Management Opportunities
While the Condition Survey precedes the detailed audit process, it can identify energy management opportunities as well. The survey rating system helps to identify and prioritize areas of the facility that deserve more extensive assessment. However, direct observations of housekeeping, maintenance, and procedural issues can lead to EMOs that need no further assessment prior to acting on them. For example, leaks in the steam system, broken glazing, loading dock doors that won’t close, and so on are “no brainers”; they need to be fixed, and they will pay off in reduced energy consumption.
Step 2: Analyze energy consumption and costs
There is information in energy billings and cost records—especially when viewed against key energy use drivers such as weather—that can lead the auditor to energy management opportunities. The analysis of energy consumption and costs historically precedes the comparison of energy performance to internal and external benchmarks. Tabulation of historical energy consumption records provides at a glance a summary of annual consumption.
The opportunities that are identified at this step in the audit may involve the reduction of energy consumption and/or cost—both being important outcomes for the audit.
The information found in energy billings begins with the rate structures or tariffs under which energy is purchased. It is important for the auditor to fully understand the structure of tariffs and the cost components since these will greatly influence savings calculations when EMOs are being assessed. Since several energy sources may be utilized in the facility, it is also important to understand the per unit energy cost of these sources, and the incremental cost (as opposed to just the average cost of energy).
In Module 4.2 Analyzing the Demand Profile, we explore the analysis of the energy tariff and the billings history, and demonstrate the tabulation of billings for the purpose of quantifying historical consumption levels and beginning the process of identifying consumption patterns.
Step 3: Comparative analysis
How does the level of energy consumption compare to other similar facilities and sites? What level of consumption is achievable with the best operating practices and performance benchmarks? How does energy consumption this year compare to last year? How does site A compare to site B on an energy performance basis?
The historical analysis of energy consumption and costs done in the previous step is ―the tip of the iceberg‖ in the sense that it organizes billing information and provides a basis for more in-depth analysis of energy performance. In particular, it provides the data needed for comparison of performance:
- internally, period to period, site to site;
- and, externally, to standards of performance established in the building sector
This method of statistical analysis of energy consumption in view of energy use determinants, such as occupancy and weather factors, generates very useful management information regarding the energy use trends and relationships that can be used to analyze performance historically, and control performance into the future.
A convenient basis of comparing the energy performance of buildings—if the impact of weather and occupancy and other unique uses of the building can be eliminated as a variable—is the consumption index: this is the total energy consumed per year per unit of occupied and conditioned floor area, expressed as MJ/m2/year.
If electrical demand is a concern, the index that is used for comparison is the demand index, which is the monthly average peak demand per unit area, expressed in VAaverage/m2/month.
Step 4: Defining the audit mandate
It is tempting to move quickly into the detailed audit itself, especially for those auditors who have a technical orientation. However, knowing the ―ground rules‖ in advance, as in any enterprise, will contribute greatly to the most effective use of time, and provide assurance that the needs of those commissioning the audit are met.
The “terms of reference” presented to the energy auditor are:
- The audit mandate—clarification of the goals and objectives of the audit, and the key constraints that will apply to actions on its recommendations;
- The audit scope—specification of the physical extent of the audit focus, and the identification of the kinds of information and analytical approaches that will comprise the auditor’s work.
The following checklist offers some guidance for articulating a clear and concise audit mandate.
| Audit Mandate Checklist |
| Audit Objectives: Investment and Operational Needs/Desires: -To save : -Energy Consumption/Cost -Specific fuel type (details): -Maximum demand -To accommodate increased load in building -To pass energy costs directly to tenants/departments -To limit manual operation of facility/processes -Other (Specify): |
| Time Line: Completion date required:_____________________________ Preliminary findings required:__________________________ |
| Building Conditions: -Note all problems related to: -Comfort -Breakdowns -Lack of Capacity -Appearance -Noise -Operational Practices -Maintenance Practices -Other(Specify):____________________________________________________________________________________________ _________________________________________________________________________________________________________ _________________________________________________________________________________________________________ _________________________________________________________________________________________________________ |
| Implementation Factors and Constraints: Housekeeping EMOs time line:____________________________________________________________________________ Low-cost EMOs time line: _________________________________________________________________________________ Financial Constraints:______________________________________________________________________________ Retrofit EMOs time line: ___________________________________________________________________________________ Financial Constraints:______________________________________________________________________________ |
| Applicable Grants, Subsidies and Tax Advantages:_________________________________________________________ _____________________________________________________________________________________________________________ _____________________________________________________________________________________________________________ Possibility of Audit Recommendation being applied to other buildings/areas: –Yes –No Details: _____________________________________________________________________________________________________________ _____________________________________________________________________________________________________________ _____________________________________________________________________________________________________________ |
| Reporting Format Required: Level of detail:_____________________________________________________________________________________________ Financial Analysis/criteria required:________________________________________________________________________ _____________________________________________________________________________________________________________ Paybackperiod/criterionacceptable:________________________________________________________________________ _____________________________________________________________________________________________________________ |
Step 5: Defining the audit scope
A systematic approach to energy auditing requires the specific definition of the boundaries that apply (as we defined system boundaries in our exploration of the thermodynamic basis for energy auditing). It is the Audit Scope that provides this detailed definition of the ―system‖ to be audited.
The Audit Scope is a “scope of work” statement; that is, it defines the sources of information and the analysis that will be applied to them. The sample scope description provided below illustrates this point. As noted earlier, the system may be anything from an entire plant to a piece of processing equipment.
Define the physical extent of the audit
This step entails the definition of the audit boundary, and the specifics of the energy systems within it. Although the details of the energy load inventory will emerge from the audit process itself, it is useful to define the areas to be examined as illustrated in the Audit Scope Checklist.
Identify the Energy Inputs and Outputs
Using a schematic diagram of the area being audited, you should be able to list the energy inputs and outputs. It is important to identify all flows, whether they are deliberate, by design and measurable, or unintended, wasteful and immeasurable directly. The obvious energy flows will be electricity, fuel, steam and other direct energy inputs; and flue gas, water to drain, vented air and other apparent outputs. A less obvious energy flow may be heat loss or gain though the building envelope.
Identify Sub-Systems
As outlined in the audit scope checklist, each of the systems to be considered in the audit are identified.
| Audit Scope Checklist |
| Areas to be examined: -Whole site -Individual buildings (details):_____________________________________________________________________________ ___________________________________________________________________________________________________________ ___________________________________________________________________________________________________________ -Department (details):_____________________________________________________________________________________ ___________________________________________________________________________________________________________ ___________________________________________________________________________________________________________ External sub-system: Lighting Heating Mains Other (describe):__________________________________________________________________________________________ ___________________________________________________________________________________________________________ ___________________________________________________________________________________________________________ Individual sub-systems: -Boiler plant -Cooling system -Steam distribution -Domestic water -Refrigeration -Lighting -HVAC -Building envelope -Other(details): ___________________________________________________________________________________________________________ ___________________________________________________________________________________________________________ ___________________________________________________________________________________________________________ |
| Types of Information: -Electricity Billings -Fuel Billings -Weather Data -Facilitu Specifications/ and Drawings -Benchmarks -Other (Specify) ___________________________________________________________________________________________________________ ___________________________________________________________________________________________________________ ___________________________________________________________________________________________________________ ___________________________________________________________________________________________________________ |
| Analysis: -Correlation of Consumption with Weather -Internal/External Benchmark Analysis -Electrical Demand Analysis -Load Inventory Analysis -Payback Analysis of EMOs/other financial criteria -Other (Specify): ___________________________________________________________________________________________________________ ___________________________________________________________________________________________________________ ___________________________________________________________________________________________________________ ___________________________________________________________________________________________________________ |
Step 6: Profile energy consumption—energy use as a function of time
A considerable amount of intelligence about the operation of your facility can be derived from the electrical demand profile. This time record of electrical energy consumption provides a record of the loads that are operating at any time, and the aggregate demand that they represent. Since the cost of electricity is determined in part by the maximum demand drawn by a facility, measures to reduce the maximum demand often become apparent and contribute significantly to a lowering of your energy bill.
As well, the demand profile can reveal loads that are operating when they don’t need to be, and systems that are sized inappropriately. Taking corrective action in these instances can lead to both energy consumption and cost reductions.
Depending on the size of the facility and the resources at your disposal, it may be desirable and possible to install metering—even temporarily—at various locations to generate a profile of electrical demand. Alternatively, the electrical utility may be able to provide you with that information or assist you to obtain it by measurement.
While the demand profile is a measurement of electrical energy, it also provides information about the consumption of other forms of energy. The demand profile provides an operational fingerprint or energy signature of a facility—as such; it is a key part of any energy audit. Other methods of profiling or data logging are also discussed in Section 5.5.
— The Demand Profile
The demand profile for a facility, building, service entrance or any user of electricity is simply a record of the power demand (rate of energy use) over time. Its purpose is to provide detailed information about how the facility, as a whole, uses energy. It is, in essence, the “electrical fingerprint” of the facility. To the auditor, the demand profile is an extremely useful tool for tracking energy use.
Details on the forms that demand information can take, the methods of collecting the data, and the intelligence that can be derived from analysing it are discussed in Module 4, Section 4.2.
Step 7: Inventory energy loads
Two of the essential tools for the energy auditor to fully assess a facility are the demand profile—to characterize the electrical loads with regard to time of use and size—and the load inventory. These two tools are complimentary to the extent that they describe in quantitative detail the systems that consume energy in the facility.
The energy auditor needs to know where energy is being consumed, how much is consumed by each system, and how all the systems add up as an aggregate load. It is helpful to know how the total energy load is distributed among the various systems.
The load inventory is a systematic way of collecting and organizing this kind of information. It is a useful tool for doing “what if” assessments—estimating the impact of retrofits or other technological or operational change—of proposed measures.
— The Electrical Load Inventory (Module 6)
Making a list or inventory of all loads in a facility answers two important questions:
- Where is the electricity used?
- How much and how fast electricity is used in each category?
Often the process of identifying categories of use allows waste to be easily identified, and this often leads to low-cost savings opportunities. Identifying the high-consumption loads lets you consider the best savings opportunities first. Because the inventory also quantifies the demand (or the ―how fast‖) associated with each load or group of loads, it is invaluable in further interpretation of the demand profile.
Details on the collection of electrical load inventory data and the analysis of those data are discussed in Module 4, Section 4.3A.
— The Thermal Energy-Use Inventory – Identification of Energy Flows (Module 7)
Identification of the thermal energy flows associated with each energy use in a facility is made simple with the use of an energy flow diagram. A useful energy flow diagram will show all energy flows into the facility, all outgoing energy flows from facility to environment, and all-important energy flows within the facility.
We saw a sample energy flow diagram in Figure 3.2. Because the purpose of such a diagram is to illustrate energy flows, not to describe a process in detail, the diagram will not generally show the specific devices and equipment that are found in its various subsystem “blocks”. The flows are the important thing here.
The sum of the energy outflows must equal the purchased energy inflows. When we have the complete picture of the important internal energy flows as well as those from and to the surroundings, it is often possible to see opportunities for energy reduction and recovery.
A method for developing an energy flow diagram and finding EMOs is discussed in Module 4, Section 4.3B.
Step 8: Identify energy management opportunities
Examination of the audit process flow chart indicates that EMOs are identified at several points:
- At the walk-through stage, obvious needs for repair or operational changes that require no further assessment come to light.
- When the facility Demand Profile is examined, other opportunities having cost or consumption reduction potential are identified; for example, load shifting opportunities that lower peak demand, or loads that are on when the building is unoccupied, may become apparent.
- The Load Inventory quantifies the distribution of energy consumption among building systems, and provides a basis for reconciliation of load with billings; variances in the reconciliation and insight into load distribution can lead to yet more EMOs.
EMOs arising from the walk-through and Demand Profile are discussed in this Training. However, much remains to be done in the identification of EMOs, and it is this step in the process that is explored in this section. The intent is to identify potential EMOs and to assess their feasibility and/or cost-effectiveness. The approach described is logical and systematic.
Step 9: Assess the costs and benefits
Having identified a “basket” of EMOs, the auditor needs to provide guidance on the feasibility of measures and recommendations for implementation. To a large extent, the assessment of proposed measures focuses on their cost-benefit.
While detailed economic analysis may go beyond the parameters of the audit, nevertheless the auditor should know:
- What benefits should be taken into account;
- What costs should be included in the analysis;
- What economic indicators provide a realistic projection of the financial viability propose measure over time.
A Comprehensive Assessment
A comprehensive assessment of the benefits and cost associated with an energy savings opportunity extends well beyond the cost of the energy involved and in many cases may involve:
Benefits:
- direct energy savings
- indirect energy savings
- comfort/productivity increases
- operating and maintenance cost reductions
- environmental impact reduction
Costs:
- direct implementation costs
- direct energy costs
- indirect energy costs
- O&M cost increase
Step 10: Report for action
Regardless of how thoroughly and carefully you conduct the energy audit, and regardless of how beneficial the proposed EMOs are, nothing will be achieved unless action is taken. The link between the audit and action is the audit report.
Too often, audit reports gather dust on someone’s shelf. The goal of the Audit Report should be:
- To provide a clear account of the facts upon which your recommendations are made;
- To interest those who read the report in acting upon those recommendations.
There are principles of good technical report writing that should be followed, and are not part of this course. The auditor should review as necessary his or her technical writing skills, at least to ensure that the use of language is effective, concise and accurate, and that the style of writing is appropriate for the target audience.