
4.4 Energy Assessment – Saving Opportunities
4.4.1. A 3-step Approach to EMO Identification
All energy consuming equipment and systems were designed to meet a specific need or set of needs. This may be as simple as providing illumination in the case of a lighting system, or far more complex as in the case of the building HVAC system. Finding energy savings opportunities involves reducing the level of energy use while still meeting the original need or requirement.
This identification of EMOs begins at the point of end-use where the need or requirement is met, and proceeds methodically back towards the point of energy purchase; the sequence of reasoning is:
STEP 1 – Match usage to requirement
The first and most important step in realizing savings opportunities is to match the system to what is actually needed. The key consideration here is the duration of use and the magnitude of use. Questions that might be asked include the following:
- What is being done?
- Why is it being done?
- What energy is being consumed?
- What energy should be consumed?
STEP 2 – Maximize system efficiencies.
Once the need and usage are matched properly, the next step is to ensure that the components of the system meeting the need are operating as efficiently as possible. In this step the impact of operating conditions, maintenance and equipment/technology will be considered. Questions to guide this aspect of the investigation include:
- Could it be done the same way but more efficiently
- Are the principles behind the system being correctly addressed?
- Why is there a difference?
STEP 3 – Optimize the energy supply.
The first two steps will reduce your requirement for energy. At this point it is logical to seek the optimum source or sources for the net energy requirement.
The final step in identifying savings opportunities is to consider the supply of energy to the system and look for saving opportunities available by optimizing the supply.
Opportunities that typically fall into this category include:
- Heat Recovery
Systems that utilize waste energy streams to displace inflowing energy. Heat recovery systems range from simple ducting of warm air to complex heat pump systems.
- Heat Pumps
In addition to facilitating heat recovery, heat pumps are also used to utilize low grade energy sources such as geothermal energy (ground heat) and air. These are commonly termed “ground” and “air” source heat pumps respectively.
- Co-generation
Co-generation is often referred to as combined heat and power (CHP) systems. When facilities require hot water and/or steam coincident with a demand for electrical energy, an opportunity may exist to supply both from fuel fired combustion equipment. These systems take advantage of their disadvantages. Typically 15 to 30% efficient in converting fuel to electricity, the waste heat from the exhaust stream can provide the required thermal inflow to the appropriate facilities or processes; this can boost the overall efficiency 50 to 80+%.
- Renewable Energy Systems
This involves replacing part or all of the existing purchased energy with energy from solar, wind, ground heat or other renewable energy source. Although often not economical, there are certain applications of renewable energy that may be cost effective including:
- Off-grid use of photovoltaic (solar electricity) and wind energy
- Passive solar designs for new and existing buildings
- Fuel Switching
Fuel switching is the replacement of one fuel with another, less expensive energy source. An example might be the conversion of oil fired hot water heating to electricity.
- Purchase Optimization
In some instances, savings can be achieved by taking full advantage of opportunities to negotiate favorable rates for the purchase of electricity or fuels. The greatest benefit from this opportunity will be realized by those operations that understand their energy usage patterns, and how they may be manipulated on an ongoing basis.
It is important to recognize that the correct time to consider purchase optimization is after each of the preceding steps. It would be counter-productive to negotiate a new electricity supply contract, prior to properly managing the demand profile for the facility. Any future changes to the demand profile could make the new supply agreement less economical. Likewise, sizing a co-generation system on the basis of existing electrical and thermal loads without good usage practices in place would be less than optimal. In fact future reductions in thermal or electrical loads could make the co-generation system un-economical.
Actions at the Point of End-Use Save More
Where is the best place to begin to look for opportunities? This is a simple question with a simple answer. Begin the search for opportunities where the energy is the most expensive – at the point of end use!
Figure 1: Chilled Water Pumping System Components

Worksheet Example 1
To illustrate this point, consider the case of a system designed to pump a fluid throughout a facility. In a commercial facility this might be a chilled water pump for the air conditioning system; in a commercial facility chilled water pumps may also be found cooling process equipment. Figure 1 is a simplified picture of this system showing each component involved in the conversion of energy in this system. Energy passes through each element of the system, starting at the meter, the point of purchase, through to the heat exchanger in the terminal devices where the cooling is required; energy is constantly being converted and transferred.
Next, consider that the efficiency of each component is 100% or less. The meter would have an efficiency of very close to 100%; other components are not as good. Efficiency is defined as the ratio of the output of a system or component to its corresponding input:
Each component that has an efficiency of less than 100% wastes the difference between the energy input and output. The result of this waste is that the unit cost (R/kWh or R/MJ) of the energy increases between the input and output. The unit cost of the energy at the output may be calculated from:
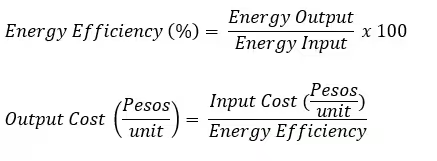
Table 1 lists each of the components of the chilled water pumping system along with a description of the losses and an estimate of the typical energy efficiency of the component for a system of moderate (10 to 100HP) size.
Table 1: Component and System Efficiencies
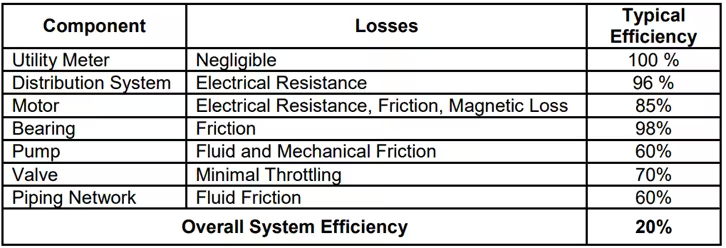
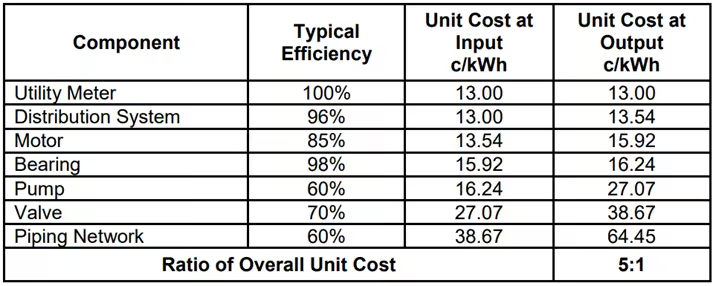
From the overall efficiency it can be seen that only one-fifth of the energy actually gets to the point where it is required. Or in other words, the system needed five times the actual end-use energy requirement, which in this case is in the form of water movement, to overcome all the losses in the system. The impact upon the unit cost of energy is illustrated in Table 2.
Clearly, the most expensive energy in the system is at the point of end-use; this is where the greatest opportunity exists to impact the overall energy efficiency of the system and hence the cost of operation.
Saving small amounts of energy in the piping network in this simple chilled water pumping system will result in large savings, on the order of five times larger, at the point of purchase.
Table 2: Unit Cost of Energy Through the System
Cost Considerations
The actions taken to reduce energy consumption can be categorized into two types:
- Changing the operation of the existing systems and equipment.
- Changing the system or equipment technology
Operational actions tend to be lower in cost to implement. Often, energy savings opportunities involving some type of operational action will be called low cost or housekeeping measures.
In contrast, those measures that require investment in new technology will tend to have a higher cost of implementation. These actions are sometimes referred to as retrofit measures.
The sequence of actions in this assessment is important. It would not be logical to install a new technology with without clearly defining what the need or requirement was. The new equipment must be sized properly to the requirement. In a similar fashion the return on investment for a piece of energy efficient technology will depend upon the operating times; any action that changes the operating times must at least be considered first.
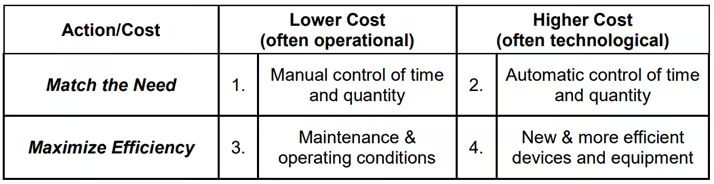
The actions that may be taken range in implementation costs. The quadrant analysis considers two distinct action/cost categories:
Lower Cost
Those actions that could be funded from operational/expense budgets and tend to be a result of operational actions.
Higher Cost
Those actions that may require capital funding of some kind and tend to involve the installation of equipment or new technology.
The Waste-Loss Analysis combines these categorizations of actions into a table with four quadrants as numbered below. Examples of actions are for a lighting system.
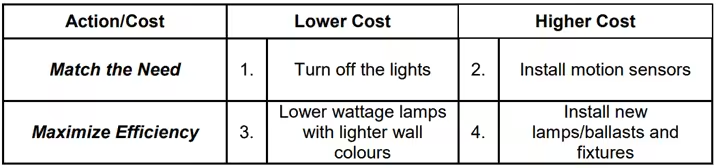
Typically, those actions that fall into the 4th quadrant have the highest cost while those in the 1st quadrant have the lowest cost. The relative cost of the 2nd and 3rd quadrants will vary depending on the specific actions and equipment.
A general form of the Waste-Loss Analysis table is given below. In this case actions have been generalized into broader categories that may exist in any energy consuming system.
Summary
The method presented in this Section provides a way to look at each of the energy consuming systems in your facility and identify opportunities. The essence of the method is, in sequence:
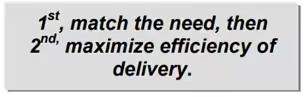
1. Verify/validate the need/requirement
2. Apply the ―Waste-Loss Analysis
Optimize the Energy Supply
The electrical and thermal inventories can provide valuable insight into the existence and magnitude of savings opportunities. In particular, they can provide the information needed to identify possible waste heat recovery opportunities, one of the approaches to “optimizing the energy supply.”
4.4.2. Assessment of the Costs and Benefits
As we saw in Module 4 for Step 9 in the Audit Process, the costs and benefits of proposed
measures need to be articulated in the audit report. In some cases, this may include a more
detailed economic analysis of these costs and savings, using methods that are developed in
Module 4.5 Economic Analysis.
The benefits and costs that should be considered are:
Benefits:
- Direct energy savings
- Indirect energy savings
- Comfort/productivity increases
- Operating and maintenance cost reductions
- Environmental impact reduction
Costs:
- Direct implementation costs
- Direct energy costs
- Indirect energy costs
- O&M cost increase
Assessment of Disadvantages Associated with Savings
The assessment of savings opportunities is generally conducted from a cost/benefit perspective.
- First, what are the savings (or the benefits) associated with the opportunity; and
- Second, what is the cost of implementation required to realize the opportunity?
Depending on the type of economic analysis used, consideration may also be given to the cost of maintenance with and without implementation.
A further and often overlooked consideration is the indirect cost which may be associated with the action to be taken. This can include such things as a reduction in illumination level and heating cost increase when lighting is reduced, since energy for lighting will contribute to building heating in the winter. An extreme indirect cost could be the reduction in personal productivity due to unexpected reductions in light levels or, possibly, a safety problem created by an improperly located motion detector that switches lights off when a space is still occupied. It may become clear that even the most attractive savings opportunity may not be attractive when all impacts are considered.
Often these costs are declared “unforeseen”. A thorough assessment should anticipate the majority of them, and clearly identify the associated risks before any changes are affected. Another consideration which is neglected is the technical and economic risk associated with the planned implementation. Savings are not always guaranteed. It is unlikely that a motion detector installed to switch lighting in a heavy traffic area will pay back. Replacement of a poorly loaded motor with an energy efficient motor may result in a lower overall efficiency owing to the partial load characteristics of the energy-efficient motor. When the savings predicted depend on varying operating conditions or occupant habits, there is a risk that the savings expected may not be realized, or be lower than predicted.
In these cases, the indirect costs are, in fact, uncertain savings. A conservative assessment would be based only on certain savings. If the uncertain savings actually occurred, then this would be a bonus.
In summary, consider not only the direct costs but also the impact that the planned implementation will have upon occupants, comfort, productivity, safety and equipment maintenance. Also consider any potential interactions between the new equipment and existing systems and the likelihood that the savings expected will be realized.
Savings
Depending on the energy source, there are potentially three areas of savings to be realized directly from a savings opportunity:
- Energy Savings: These would simply be equal to the energy saved (e.g. kWh) times the incremental energy rate (e.g. R/kWh – usually the last block energy rate).
- Demand Savings: If the step implemented has a measurable effect on the peak demand, the demand saving would be:

- Block Size Savings: (only certain rates) if there is a peak demand reduction, there may also be a reduction in the first energy block size (assuming the rate is a multi-block type). Effectively, this moves some of the energy from the more expensive first block to the less expensive second block. The savings would be:

In addition to the direct electrical savings calculated on the measure itself, there may be other considerations:
- Thermal Fuel Savings: The thermal energy saved at the point of use must be “grossed up” by the efficiency of the heating before the incremental cost of fuel or thermal energy can be applied:

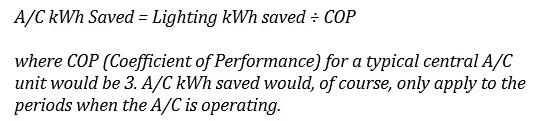
- Indirect electrical savings such as reduced air conditioning (A/C) loads due to more efficient or switched lighting. A/C savings can be calculated as:
- Less re-lamping labor and lamp cost from switching to a longer-life lamp type (e.g. replace incandescent lamps with compact fluorescent lamps offers a ten-fold increase in lamp life).
- Increase in employee productivity from converting to a higher quality, higher efficiency fixture type.
Costs
When evaluating the cost of implementing a measure, be sure to include all the costs, including:
- Initial cost of implementing the retrofit (quotes by contractors).
- Decrease in lamp life resulting in increased re-lamping costs, e.g., switching from mercury vapor lamps at 24 000 hours life to metal halide at 20 000 hours.
- Decrease in lamp life due to increase in switching, e.g., a standard 40W Rapid Start fluorescent tube operated for 10 hours per start will last 28 000 hours. The same tube operated only 3 hours per start will last 20 000 hours.
- Any increase in maintenance costs such as higher cost lamps and ballasts, higher cost of repairs or lower life of any replacement energy-efficient equipment.
- Increase in heating costs due to more efficient or switched lighting (assuming heat from lights ends up as useful space heat). This heating increase can be calculated as:

Again, the lighting kWh saved would only apply to periods when the heating system is operated. The heating system efficiency could typically range from 0.75 (oil) to 0.85 (gas or propane) to 1 (resistive electric) to 3 (i.e. the COP of a heat pump).